
Harnessing Big Data for Smarter Stock Market Decisions
In today’s fast-paced financial markets, big data is revolutionizing trading strategies by providing deeper insights, predictive analytics, and real-time decision-making capabilities. Traders and investors who leverage big data analytics gain a competitive edge by identifying trends, minimizing risks, and maximizing returns.
Investing in the stock market is not a game. One wrong decision, and your hard-earned money can go down the drain. But what if you had a tool that could predict market trends in advance? That’s where Big Data comes in! In today’s era, when terabytes of data are generated every second, Big Data has become a game-changer for stock market investors. In this article, we’ll discuss what Big Data is, how it works in the stock market, and how you can use it to make smarter decisions. So, let’s get started!

What is Big Data and Why is it Important for the Stock Market?
Big Data refers to the vast amount of data that exists in structured or unstructured forms. This data is so massive that regular software cannot handle it. In the context of the stock market, Big Data includes company financials, market trends, news articles, social media sentiments, and even weather patterns that can affect the market.
If you look at it, the real power of Big Data lies in its speed, variety, and volume. Every second, market prices change, news articles are published, and investors’ tweets influence the market. Big Data analyzes all of this to find patterns that are impossible for a human to detect.
Example: In 2018, when Tesla’s CEO Elon Musk tweeted that he wanted to take Tesla private, Tesla’s stock price surged by 11% in a single day. Big Data tools analyzed the sentiment of this tweet and immediately signaled to investors that a stock movement was about to happen. Without such signals, regular investors would miss out.
Key Ways Big Data Enhances Stock Market Decisions:
- Predictive Analytics – Machine learning models analyze historical and real-time data to forecast stock movements, helping traders make informed decisions.
- Sentiment Analysis – By processing news, social media, and earnings reports, AI detects market sentiment shifts before they impact prices.
- Algorithmic Trading – Big data powers high-frequency trading (HFT) algorithms that execute trades in milliseconds based on real-time trends.
- Risk Management – Advanced analytics assess volatility, correlations, and macroeconomic factors to optimize portfolio diversification.
- Alternative Data Sources – Satellite imagery, credit card transactions, and IoT data provide unconventional yet valuable market insights.
Read more:
- Skyrocketing Profits with Real-Time Stock Data Analytics
- The Beginner’s Guide to AI Stock Trading Success
How is Big Data Used in the Stock Market?
Big Data is utilized in the stock market in several ways. It not only predicts trends but also aids in risk management and portfolio optimization. Let’s explore some key areas:
1. Understanding Market Mood with Sentiment Analysis
Social media and news articles significantly influence market sentiment. Big Data tools, such as Natural Language Processing (NLP), scan millions of tweets, Reddit posts, and news headlines to analyze market sentiment. This reveals whether people are feeling positive or negative about a company.
Case Study: Remember the GameStop frenzy in 2021? Retail investors on Reddit’s WallStreetBets forum pushed GameStop’s stock from $20 to $483. Big Data algorithms analyzed the sentiment in Reddit posts and alerted institutional investors that the stock was about to skyrocket. Investors who understood this signal made significant profits.
In the stock market, success isn’t just about numbers and charts. The market’s “mood” is equally important. What is this mood? It’s how people feel about a company or stock—positive, negative, or neutral. A powerful way to understand this mood is through Sentiment Analysis. This Big Data tool analyzes social media, news, and public opinions to indicate where the market is headed. Let’s break it down from basics to advanced, with real-life examples, to make this concept crystal clear!
What is Sentiment Analysis?
In simple terms, Sentiment Analysis is a technology that scans large data sets (like tweets, news articles, Reddit posts) and extracts emotions or opinions. It shows how people feel about a stock, company, or industry. This is crucial for the stock market because public sentiment directly impacts prices.
How Does It Work?
Sentiment Analysis uses Natural Language Processing (NLP), where AI and machine learning algorithms analyze words, phrases, and even emojis. Each statement is categorized into three types:
- Positive: “This stock is going to the moon!” 😍
- Negative: “This company’s future looks bad.” 😞
- Neutral: “The market was stable yesterday.” 😐
Example: If 70% of Twitter users are excited about a company’s new product, Sentiment Analysis assigns a “Positive” score. This signals traders that the stock price might jump.
Basic Components of Sentiment Analysis
If you’re a beginner, it’s important to understand the main components of Sentiment Analysis:
- Data Sources: Where does the data come from? Social media (Twitter, Reddit, StockTwits), news websites (Bloomberg, CNBC), blogs, and even company earnings call transcripts. Each source has its own weight. For instance, a verified analyst’s tweet carries more impact than a random user’s post.
- Text Processing: Raw data (like tweets) is cleaned. This includes understanding hashtags, emojis, and slang. For example, “to the moon” indicates positive sentiment for a stock.
- Scoring System: Each piece of data is analyzed and given a score (usually from -1 to +1). A negative score indicates bearish sentiment, while a positive score suggests bullish sentiment.
Real-Life Example: In 2021, Dogecoin’s craze was fueled by Elon Musk’s tweet (“Doge to the moon”), which made its sentiment highly positive. The price surged 30% within hours. Sentiment Analysis tools detected this tweet’s impact instantly and alerted traders.
How Sentiment Analysis is Used in the Stock Market
Let’s explore how this works in the market and how you can leverage it:
- Stock Price Prediction
Sentiment Analysis can predict short-term market movements. If there’s a lot of positive buzz about a company, its stock price is likely to rise. The opposite is also true.
Case Study: In 2018, when Tesla faced production issues, Sentiment Analysis tools detected that 60% of Twitter posts were negative. Traders took short positions and profited when the stock fell. - Event-Based Trading
Is a major event like a product launch, earnings call, or merger coming up? Sentiment Analysis tracks public mood before and after the event to predict its market impact.
Example: In 2020, before Apple’s 5G iPhone launch, Twitter and Reddit were buzzing with excitement. Sentiment Analysis gave a positive score, and Apple’s stock rose 7% post-launch. - Risk Management
Sentiment Analysis highlights risks. If negative sentiment about a stock spikes suddenly (e.g., scam allegations), it warns you to exit your position.
Pro Tip: Sentiment Analysis is more effective for short-term trading. For long-term investors, combine it with fundamental analysis.
Advanced Techniques in Sentiment Analysis
For those who want to dive deeper, here are advanced techniques that make Sentiment Analysis more powerful:
- Contextual Analysis: It’s not just about words; context matters. For example, “This stock is a disaster” could be sarcastic. Advanced NLP models understand sarcasm and context.
- Real-Time Processing: Being even a second late in the market means missing opportunities. Advanced tools analyze millions of posts in real-time to provide instant signals. Hedge funds use cloud-based platforms for this.
- Cross-Platform Correlation: Sentiment is compared across platforms (Twitter, Reddit, news). If the vibe is positive everywhere, the signal is stronger.
- Sentiment Scoring Models: Advanced models use weighted scoring. For instance, a famous analyst’s opinion carries more weight than a random user’s.
Case Study: The 2021 GameStop saga. The sentiment on WallStreetBets was so strong that GameStop’s stock soared from $20 to $483. Advanced Sentiment Analysis tools combined data from Reddit, Twitter, and news to predict that retail investors would create a massive movement.
Tools and Platforms for Sentiment Analysis
You can use Sentiment Analysis too. Here are some popular tools:
- StockTwits: A platform specifically for stocks where traders share opinions. It has built-in sentiment analysis.
- RavenPack: A professional tool offering real-time sentiment from news and social media, but it’s expensive.
- Twitter APIs: Free or low-cost APIs let you extract Twitter data and perform basic sentiment analysis.
- Google Trends: Indirectly shows how popular a company or stock is, giving hints about sentiment.
Beginner Tip: Start with StockTwits or Twitter. Gradually explore paid tools like RavenPack or Bloomberg Terminal.
How Big Data Transforms Stock Market Trading: A Deep Dive
The stock market is no longer just about charts and gut feelings—Big Data has revolutionized trading by enabling data-driven decisions, predictive analytics, and real-time insights. From sentiment analysis to algorithmic trading, Big Data is reshaping how investors and institutions approach the market.
1. Sentiment Analysis: Decoding Market Emotions
What is Sentiment Analysis?
Sentiment Analysis uses Natural Language Processing (NLP) to scan social media, news, and financial forums to gauge public opinion on stocks. It categorizes emotions as:
- Positive (Bullish) – e.g., “This stock is skyrocketing!”
- Negative (Bearish) – e.g., “This company is doomed.”
- Neutral – e.g., “The market is steady today.”
How It Works in Trading
- Real-Time Social Media Monitoring: Tools analyze Twitter, Reddit (WallStreetBets), and StockTwits to detect trends before they impact prices.
- Event-Driven Trading: Earnings calls, product launches, or scandals trigger sentiment shifts—traders capitalize on these movements.
- Risk Management: Sudden negative sentiment (e.g., fraud allegations) can signal an exit before a crash.
Case Study: GameStop (2021)
- Reddit’s WallStreetBets drove GameStop ($GME) from $20 to $483 in weeks.
- Big Data tools detected the unprecedented bullish sentiment, allowing early investors to profit before the squeeze.
2. Predictive Analytics & Algorithmic Trading
How Big Data Predicts Stock Movements
- Machine Learning Models analyze historical data, news, and macroeconomic trends to forecast price movements.
- High-Frequency Trading (HFT) uses real-time data to execute trades in milliseconds, exploiting micro-trends.
Case Study: Hedge Funds & AI-Driven Trading
- Firms like Renaissance Technologies use Big Data to run quantitative models, outperforming traditional investors.
- BlackRock’s Aladdin platform processes petabytes of data daily to optimize portfolios.
3. Alternative Data: Beyond Traditional Metrics
Big Data isn’t just about earnings reports—unconventional data sources provide unique insights:
| Data Source | How It’s Used | Example |
|---|---|---|
| Satellite Imagery | Tracks retail/store traffic | Walmart parking lot fullness predicts sales. |
| Credit Card Transactions | Measures consumer spending trends | Visa data reveals Apple product demand. |
| Web Scraping | Monitors job postings, supply chain changes | Tesla hiring spikes hint at expansion. |
| IoT & Sensor Data | Tracks shipping, oil reserves | Oil tanker movements predict crude prices. |
Challenges and Limitations
Sentiment Analysis isn’t perfect. Here are some challenges:
- Noise in Data: Social media is full of fake news or bots that can skew sentiment.
- Over-Reliance: Don’t trade solely based on sentiment. Technical and fundamental analysis are also crucial.
- Cultural Nuances: In the Indian market, analyzing sentiment in local languages (Hindi, Tamil, etc.) can be tough, as most tools are English-focused.
Example: In 2019, Yes Bank had mixed sentiments on social media. Some tools gave a positive score, but the bank’s weak fundamentals led to a crash. This shows you shouldn’t blindly follow sentiment.
How to Get Started?
To use Sentiment Analysis, follow these steps:
- Join Social Media: Be active on Twitter and StockTwits. Follow hashtags like #Nifty50 or #StockMarket.
- Try Free Tools: Start with Google Trends or StockTwits’ sentiment indicators.
- Learn NLP Basics: If you’re tech-savvy, learn Python libraries like NLTK or TextBlob for custom analysis.
- Paper Trading: Test sentiment signals on virtual platforms before real trades.
- Stay Balanced: Combine sentiment with company financials and market trends.
2. Predicting Future Trends with Predictive Analytics
Big Data’s machine learning models analyze past data to predict future trends. These models examine company financials, market conditions, and even global events like geopolitical tensions.
Example: During the 2020 COVID-19 crash, stocks like Zoom and Microsoft skyrocketed. Big Data tools predicted that work-from-home companies would see a surge. Investors who followed these predictions earned 100-200% returns.
Predicting stock market movements is like walking a tightrope—get it right, and you can make huge profits; get it wrong, and you face losses. Predictive Analytics is a powerful Big Data tool that analyzes past and present data to forecast future market trends. Let’s dive into this concept from basics to advanced, with real-life examples and case studies, to make it crystal clear and show how you can use it!
What is Predictive Analytics?
Predictive Analytics uses machine learning and statistical models to analyze large data sets and predict future patterns or outcomes. In the stock market, it looks at company financials, historical stock prices, global events, and even social media trends to forecast what’s next—whether a stock price will rise or fall, a market crash is coming, or a sector will boom.
In simple terms, it’s like a crystal ball that makes educated guesses about the future based on past data and current trends. But it’s not magic—it’s backed by solid math and algorithms.
How Does It Work?
- Data Collection: Massive data is gathered—stock prices, trading volumes, company earnings, news, and macroeconomic factors (like interest rates, inflation).
- Data Cleaning: The data is cleaned to remove errors or irrelevant information.
- Model Building: Machine learning models (like regression or neural networks) are created to find patterns.
- Prediction: The model analyzes data to forecast future trends or events.
- Validation: Predictions are tested against past data to check accuracy.
Example: During the 2020 COVID-19 pandemic, Predictive Analytics models predicted that tech companies like Zoom and Amazon would surge due to the rise in work-from-home and e-commerce trends. Investors who followed these predictions made 100-200% returns.
Basic Components of Predictive Analytics
If you’re a beginner, it’s important to understand the key elements of Predictive Analytics:
- Historical Data: The foundation. It includes past stock prices, trading volumes, and company performance. More data means better predictions.
- External Factors: Factors outside the market, like GDP growth, political events, or weather patterns, are included. For example, oil stocks can be affected by hurricane seasons.
- Algorithms: Linear regression, decision trees, and neural networks find patterns.
- Real-Time Data: Modern models analyze real-time data (like news and social media) to capture the latest trends.
Real-Life Example: In 2018, Predictive Analytics tools predicted a bullish trend for Amazon’s stock due to strong growth in its cloud computing division (AWS). The prediction was accurate, and Amazon’s stock rose 28% that year.
How Predictive Analytics is Used in the Stock Market
Predictive Analytics has several practical uses to sharpen your trading or investment decisions:
- Stock Price Forecasting
It predicts where a stock’s price will go in the short or long term by analyzing historical prices, company performance, and market conditions.
Case Study: In 2019, Predictive Analytics models gave a bearish signal for Netflix’s stock due to slowing subscriber growth and competition from Disney+. Traders who followed this signal profited by shorting the stock when it fell. - Sector and Industry Trends
Sometimes, an entire sector moves up or down. Predictive Analytics identifies which sector will be the next big thing.
Example: In 2021, bullish predictions for the renewable energy sector emerged as governments focused on green energy. Companies like Tesla and First Solar delivered 50-100% returns. - Risk Assessment
It measures portfolio risk and identifies which stocks or sectors are volatile, helping you diversify your investments.
Case Study: During the 2020 market crash, Predictive Analytics models flagged high-beta stocks (like airlines and hospitality) as high-risk. Investors exited these stocks and shifted to safer assets like gold or bonds. - Event-Based Predictions
Major events (like Federal Reserve interest rate decisions or company earnings) move the market. Predictive Analytics forecasts their impact.
Example: In 2022, when the US Federal Reserve announced interest rate hikes, Predictive Analytics predicted a correction in tech stocks, as high interest rates hurt growth stocks. This was accurate, and the Nasdaq fell 33%.
Advanced Techniques in Predictive Analytics
For those who want to go deeper, here are advanced techniques that make Predictive Analytics more powerful:
- Ensemble Models: Combining multiple algorithms (like Random Forest and Neural Networks) increases accuracy.
- Sentiment Integration: Social media and news sentiment is added to models. For example, negative Twitter buzz can drag a stock price down.
- High-Frequency Trading (HFT) Data: Advanced models analyze micro-second-level trading data to predict intra-day trends.
- Scenario Analysis: Models test “what-if” scenarios, like “What happens to energy stocks if oil prices rise 20%?”
Case Study: The 2021 GameStop short squeeze. Predictive Analytics models combined retail sentiment (from Reddit’s WallStreetBets) and short interest data to predict that GameStop’s stock would explode. The prediction was spot-on, with the stock soaring from $20 to $483.
Tools and Platforms for Predictive Analytics
You can use Predictive Analytics too. Here are some popular tools:
- TradingView: Offers historical data and basic predictive models, great for beginners.
- QuantConnect: For advanced users, this platform lets you build custom predictive models using Python or C#.
- Bloomberg Terminal: A professional-grade tool for real-time predictive analytics, but it’s expensive.
- Python Libraries: If you’re tech-savvy, use libraries like Pandas, Scikit-learn, and TensorFlow to build your own models.
Beginner Tip: Start with TradingView or Yahoo Finance. Free tools are powerful enough for basic predictions.
Challenges and Limitations
Predictive Analytics is powerful but has limitations:
- Data Quality: Inaccurate or incomplete data leads to wrong predictions.
- Overfitting: Models may fit past data too well and fail in the future.
- Unpredictable Events: Black swan events (like pandemics or geopolitical crises) are hard to predict.
- Cost: Advanced tools and data subscriptions can be expensive.
Example: In the 2016 US election, Predictive Analytics models gave a high probability of Hillary Clinton winning. But Donald Trump won, causing unexpected market volatility. This shows human behavior isn’t always predictable.
How to Get Started?
To start with Predictive Analytics in the stock market, follow these steps:
- Learn Basics: Understand historical data and technical indicators (like Moving Averages, RSI).
- Use Free Tools: Explore charts and predictions on TradingView or Yahoo Finance.
- Practice Coding: If you want to go advanced, learn Python and build simple models.
- Paper Trading: Test predictions on virtual platforms before investing real money.
- Stay Updated: Keep an eye on news and global events, as they’re key inputs for models.
3. The Power of Big Data in Risk Management
The stock market always involves risk, but Big Data can minimize it. These tools analyze portfolio risk and identify which stocks or sectors are risky. Additionally, Big Data provides real-time alerts for sudden market crashes or rising volatility.
Case Study: The 2010 Flash Crash, when the Dow Jones dropped 9% in a single day. Today, Big Data tools can detect such events in advance by analyzing high-frequency trading data, giving traders time to adjust their positions.
Investing in the stock market always comes with risks. A market crash, a company scandal, or global events can turn things upside down. But what if you could predict these risks in advance and protect your investments? This is where Big Data becomes your superhero! In Risk Management, Big Data not only helps you avoid losses but also optimizes your portfolio. Let’s explore this from basics to advanced, with real-life examples and case studies, to make it crystal clear!
What is Risk Management with Big Data?
Risk Management involves protecting your investments from market ups and downs. It includes understanding which stocks or sectors are risky, when the market might become volatile, and how to minimize losses. Big Data supercharges this process by analyzing massive amounts of data—like historical market trends, company financials, global economic indicators, and even social media sentiments.
Big Data tools provide real-time insights and identify patterns that are impossible for humans to spot. They tell you where risks are hiding and how to handle them.
How Does It Work?
- Data Aggregation: Big Data platforms collect company data, market data, news, and external factors (like geopolitical events) in one place.
- Risk Identification: Machine learning models look for signs of risks, like sudden price drops or negative news.
- Risk Scoring: Each stock or portfolio is assigned a risk score, indicating the level of risk involved.
- Real-Time Alerts: If a sudden risk (like a market crash) is detected, Big Data tools send instant alerts.
Example: During the 2020 COVID-19 market crash, Big Data tools detected in February that travel and hospitality stocks (like airlines) were in a high-risk zone. Investors who followed these alerts shifted to safer assets like gold or bonds, avoiding losses.
Basic Components of Big Data in Risk Management
If you’re a beginner, it’s important to understand how Big Data works in risk management and its key elements:
- Historical Data Analysis: By analyzing past market crashes, stock corrections, and volatility patterns, Big Data predicts what might happen in similar conditions.
- Real-Time Monitoring: Tracks live market data (like stock prices, trading volumes) to detect sudden risks.
- External Triggers: Predicts how global events (like wars, elections, or natural disasters) will impact the market.
- Portfolio Diversification: Identifies which stocks or sectors might crash together, helping you diversify your portfolio.
Real-Life Example: In 2018, during the US-China trade war, Big Data tools predicted that tech and manufacturing stocks (like Apple and Caterpillar) would be volatile. Investors reduced exposure to these stocks and shifted to safer sectors like utilities.
Practical Uses of Big Data in Risk Management
Big Data enhances risk management in several ways. Let’s look at key areas:
- Portfolio Risk Assessment
Big Data scans your portfolio and identifies which stocks or sectors could put you at risk. It performs correlation analysis to see which assets might crash together.
Case Study: During the 2008 financial crisis, banks and real estate stocks crashed together. Today, Big Data tools can detect such correlations in advance. In 2022, when inflation was high, Big Data showed a high correlation between growth stocks (like tech) and bonds, prompting investors to rebalance their portfolios. - Volatility Prediction
Big Data’s predictive models forecast when the market will be volatile, using indicators like VIX (Volatility Index), news sentiment, and macroeconomic data.
Example: The 2010 Flash Crash, when the Dow Jones dropped 9% in a day. Big Data tools can now detect such events by analyzing high-frequency trading data, giving traders time to adjust positions. - Fraud and Scam Detection
Big Data analyzes company financials, insider trading patterns, and news to detect signs of fraud or scams, protecting retail investors from fake companies.
Case Study: Before Yes Bank’s 2019 collapse, Big Data tools detected that its non-performing assets (NPAs) were dangerously high and negative sentiment was rising on social media. Investors who noticed these signals sold their holdings and avoided losses. - Stress Testing
Big Data runs “what-if” scenarios, like “How will my portfolio perform if interest rates rise by 2%?” This stress testing prepares your portfolio for future shocks.
Example: In 2022, when the Federal Reserve began interest rate hikes, Big Data tools ran stress tests and showed that tech stocks were in a high-risk zone. Hedge funds reduced tech holdings and shifted to safer assets.
Advanced Techniques in Big Data for Risk Management
For those who want to dive deeper, here are advanced techniques that make Big Data more powerful in risk management:
- Machine Learning Models: Neural networks and ensemble models find complex patterns that traditional methods might miss. For example, they can detect unnatural stock price movements.
- Real-Time Anomaly Detection: Analyzes high-frequency trading data to detect sudden spikes or drops that signal risks.
- Sentiment-Driven Risk Models: Incorporates social media and news sentiment into risk assessment. Negative sentiment can trigger sudden sell-offs.
- Network Analysis: Maps interconnections between companies (like supply chains) to predict how one company’s failure might impact others.
Case Study: In 2021, the Archegos Capital collapse caused market chaos due to failed leveraged bets. Big Data tools detected signs of high leverage and interconnected holdings beforehand, serving as a warning signal for alert investors.
Tools and Platforms for Big Data Risk Management
You can use Big Data for risk management too. Here are some popular tools:
- Bloomberg Terminal: A professional tool for real-time risk analytics and portfolio assessment, but it’s costly.
- Riskalyze: Offers portfolio risk scoring and stress testing for retail investors.
- TradingView: Provides basic risk indicators like volatility and correlation charts.
- Python Libraries: If you’re tech-savvy, libraries like Pandas and Scikit-learn help build custom risk models.
Beginner Tip: Start with user-friendly tools like TradingView or Riskalyze. Gradually explore advanced platforms like Bloomberg.
Challenges and Limitations
Big Data is a game-changer for risk management, but it has challenges:
- Data Overload: With so much data, extracting useful insights can be tough.
- False Positives: Tools may give incorrect risk signals, causing unnecessary panic.
- Cost: High-end tools and data subscriptions can be expensive.
- Unpredictable Events: Black swan events (like pandemics) are hard to predict.
Example: During Brexit in 2016, Big Data models underestimated the market crash’s intensity because it was a rare event. This shows that human judgment is still crucial alongside Big Data.
How to Get Started?
To start using Big Data for risk management, follow these steps:
- Portfolio Analysis: Scan your current portfolio on TradingView or Riskalyze to check its risk score.
- Learn Indicators: Understand volatility indicators like VIX and Beta.
- Use Free Tools: Get basic risk insights from Yahoo Finance or Google Finance.
- Paper Trading: Test risk management strategies on virtual platforms.
- Stay Informed: Monitor news and global events, as they’re major risk triggers.
Big Data Tools and Technologies You Can Use
Here are some tools and technologies to leverage Big Data in the stock market:
- StockTwits: A platform for stock-related discussions with built-in sentiment analysis, ideal for beginners.
- RavenPack: A professional tool for real-time sentiment and risk analytics, but it’s expensive.
- TradingView: Offers charts, basic predictive models, and risk indicators, suitable for all levels.
- Bloomberg Terminal: A high-end tool for real-time analytics, sentiment, and risk management, but costly.
- QuantConnect: Allows advanced users to build custom predictive models using Python or C#.
- Python Libraries: Libraries like Pandas, Scikit-learn, NLTK, and TensorFlow let tech-savvy users create custom sentiment, predictive, or risk models.
- Google Trends: Provides indirect insights into a stock or company’s popularity, hinting at sentiment.
- Twitter APIs: Free or low-cost APIs for extracting Twitter data for sentiment analysis.
Beginner Tip: Start with free or user-friendly platforms like StockTwits, TradingView, or Google Trends. As you gain experience, explore advanced tools like RavenPack, Bloomberg Terminal, or Python-based solutions.
By leveraging these Big Data tools and techniques, you can make smarter, data-driven decisions in the stock market, whether you’re predicting trends, managing risks, or optimizing your portfolio. Start small, test your strategies, and combine Big Data insights with fundamental and technical analysis for the best results!
Big Data Tools Aur Technologies Jo Aap Use Kar Sakte Hain
How Can You Use Big Data in the Stock Market?
The question now is, how can you leverage Big Data? There are several popular tools and platforms that retail investors can use:
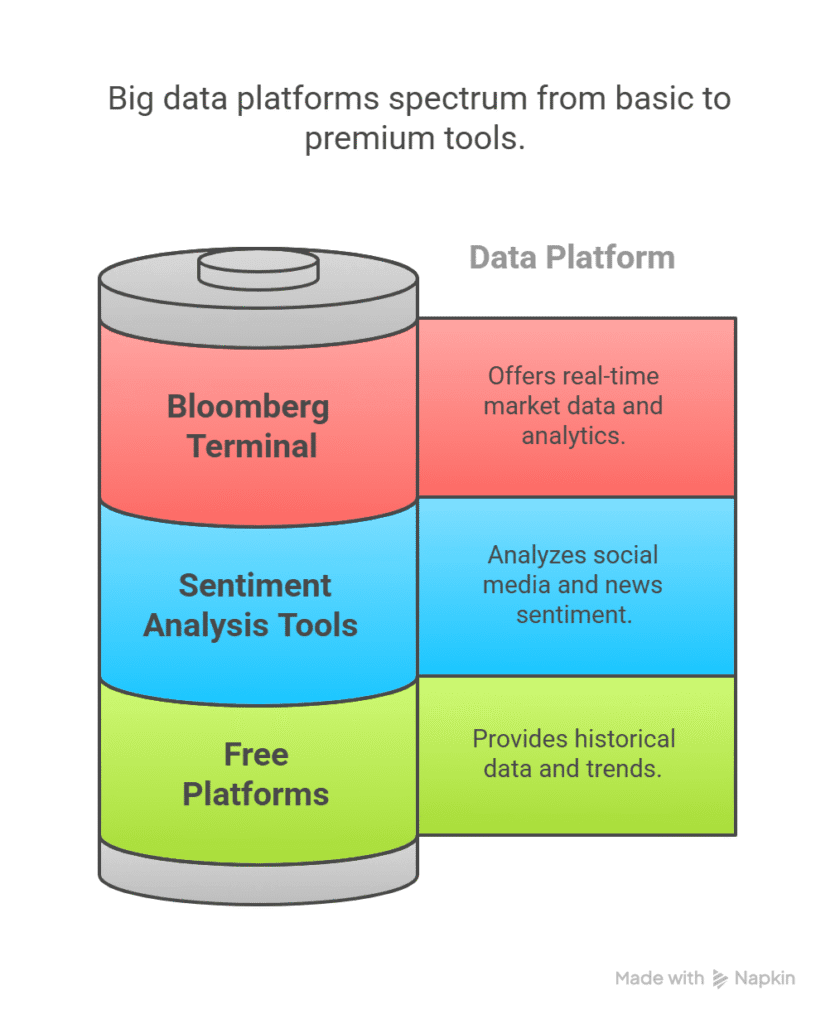
- Bloomberg Terminal: A premium tool providing real-time market data and analytics. It’s widely used by hedge funds, but its cost is very high.
- Sentiment Analysis Tools: Platforms like StockTwits or RavenPack analyze social media and news sentiment.
- Free Platforms: Yahoo Finance and Google Finance offer basic Big Data insights, such as historical data and trends.
Pro Tip: If you’re a beginner, start with free tools. As your experience grows, you can explore paid tools like Bloomberg or TradeStation.
Challenges and Limitations of Big Data in the Stock Market
Big Data is powerful, but it comes with limitations. The biggest challenge is data overload. With so much data, extracting useful information can be difficult. Another issue is that Big Data tools can be expensive, often unaffordable for retail investors.
Additionally, Big Data isn’t always 100% accurate. False signals can occur, so combining Big Data with fundamental analysis is crucial.
Example: During the 2016 Brexit referendum, Big Data models predicted the UK would vote against Brexit. However, the opposite happened, leading to a market crash. This shows that human judgment is essential alongside Big Data.
Big Data is a game-changer in the stock market. It helps predict trends, manage risks, and make smarter decisions. However, it’s not a magic wand! Big Data has its own challenges and limitations that create hurdles for both retail investors and professionals. Understanding these limitations is key to avoiding over-reliance and maximizing its benefits. Let’s dive into these challenges and limitations from basics to advanced, with real-life examples and case studies, to make the concept crystal clear!
What Are the Challenges and Limitations of Big Data?
Big Data is powerful, but it has weaknesses that impact its effectiveness at technical, financial, and practical levels. These weaknesses can affect your trading or investment decisions. Big Data tools analyze billions of data points, but sometimes the data or algorithms can produce misleading signals or create practical difficulties. Let’s break down the main challenges and limitations.
1. Data Overload: Too Much Data, Too Much Confusion
The biggest challenge with Big Data is data overload. Every second, the market generates massive amounts of data—stock prices, trading volumes, news articles, social media posts, economic reports, and more. Processing this data and extracting useful insights is a significant challenge, especially for retail investors.
Why Is It a Problem?
- Filtering relevant information from vast data is difficult.
- Irrelevant or noisy data can lead to incorrect conclusions.
- For beginners, the sheer volume of data can be overwhelming.
Real-Life Example: In 2020, when markets were volatile due to COVID-19, Big Data tools generated conflicting data from news, tweets, and economic reports. Some tools gave bullish signals, while others were bearish, confusing retail investors who made wrong trades and faced losses.
Solution: Use advanced algorithms or curated platforms like Bloomberg Terminal for data filtering and prioritization. Beginners should start with simpler tools like Yahoo Finance.
2. High Costs: Big Data Isn’t in Everyone’s Budget
Access to Big Data tools and platforms can be expensive. Professional-grade tools like Bloomberg Terminal, RavenPack, or high-frequency trading data subscriptions can cost lakhs of rupees. This is a major limitation for retail investors with limited budgets.
Why Is It a Problem?
- Without premium tools, you may get limited or outdated data.
- Free tools like Google Finance lack advanced analytics.
- Cloud computing and real-time data processing require costly infrastructure.
Case Study: In 2021, during the GameStop short squeeze, professional hedge funds used high-end Big Data tools (like sentiment analysis platforms) to track retail crowd movements. Retail investors relying on free platforms got delayed insights, leading some to buy at peak prices and incur losses.
Solution: Beginners can start with free or low-cost tools like TradingView or StockTwits. If your budget allows, consider paid subscriptions later.
3. False Signals and Inaccuracy
Big Data predictions aren’t always 100% accurate. Sometimes, tools produce false positives or false negatives, misleading signals that can derail your trades. This happens when models overfit (fit past data too closely) or when data is incomplete.
Why Is It a Problem?
- False signals can lead to wrong trades.
- Overfitting causes models to fail in predicting future trends.
- Sentiment analysis can be skewed by bots or fake news.
Real-Life Example: During the 2016 Brexit referendum, Big Data models predicted the UK would vote against Brexit, expecting market stability. The opposite result caused a global market crash, and investors relying on these signals faced significant losses.
Solution: Don’t blindly follow Big Data signals. Cross-check them with fundamental analysis (like company financials) and technical analysis (like chart patterns).
4. Unpredictable Events: The Fear of Black Swan Events
The stock market sometimes faces unpredictable events, called black swan events, like pandemics, geopolitical crises, or sudden policy changes. Big Data struggles to predict these due to their lack of historical patterns.
Why Is It a Problem?
- Black swan events can cause Big Data models to fail.
- These events create sudden and massive market volatility.
- Investors over-relying on Big Data may be unprepared.
Case Study: In early 2020, when COVID-19 became a global pandemic, Big Data models underestimated its intensity. Many predicted a temporary market correction, but global markets crashed 30-40% in March 2020. This highlights Big Data’s limitations with rare events.
Solution: Always have a backup plan, like stop-loss orders or a diversified portfolio. Combine Big Data with human judgment and risk management strategies.
5. Technical Complexity: Not Everyone’s Cup of Tea
Using Big Data tools can be technically challenging. Machine learning models, data pipelines, and real-time analytics require coding skills (like Python or R) and technical knowledge. This is a significant barrier for retail investors.
Why Is It a Problem?
- Without technical expertise, you can’t fully utilize advanced tools.
- Interpreting data requires market knowledge and experience.
- Complex dashboards or analytics can be hard for beginners to understand.
Example: In 2021, many retail investors tried platforms like QuantConnect to predict GameStop trends. Due to limited coding and data science knowledge, they struggled to extract meaningful insights and made wrong trades.
Solution: Start with simple, user-friendly platforms like TradingView or Riskalyze. If you’re interested, learn basic Python or data analysis through online courses.
6. Ethical and Privacy Concerns
Another challenge is data privacy and ethical issues. Using social media data, user behavior, or personal financial information is restricted under privacy laws (like GDPR). Additionally, Big Data tools can sometimes produce biased results, increasing the risk of market manipulation.
Why Is It a Problem?
- Data collection requires user consent, which is challenging for platforms.
- Biased algorithms can lead to incorrect predictions, like artificially hyping a stock.
- Regulatory scrutiny can limit Big Data tool operations.
Example: In 2018, the Cambridge Analytica scandal highlighted social media data misuse. In the stock market, unethical use of Twitter or Reddit data for sentiment analysis could create legal issues.
Solution: Use reputed platforms that follow data privacy laws. Check your data-sharing settings.
How to Overcome These Challenges?
Despite Big Data’s limitations, you can manage them:
- Start Small: Use free tools like Yahoo Finance or TradingView to avoid data overload.
- Combine Analyses: Pair Big Data with fundamental and technical analysis to reduce false signals.
- Stay Updated: Monitor news and global events to prepare for black swan events.
- Learn Basics: Gain data interpretation and basic coding skills to overcome technical barriers.
- Diversify: Maintain a diversified portfolio to minimize the impact of unpredictable events.
How to Get Started with Big Data?
Hearing about Big Data in the stock market might make it seem complex, reserved for hedge funds or tech experts. But that’s not true! Retail investors can also use Big Data to make smarter decisions. Whether you’re a beginner or have some experience, Big Data can help you understand market trends, manage risks, and boost profits. The question is—where do you start? Let’s break it down with a step-by-step guide in simple language, complete with real-life examples and practical tips, so even a 10th grader can understand!
Basic Plan to Start with Big Data
Starting with Big Data is a journey that requires patience and learning. You don’t need to become an expert overnight or invest heavily. Take small steps, explore free tools, and gradually build your skills. Here’s a practical guide to make you confident in using Big Data in the stock market.
Step 1: Start with Basic Tools
The easiest way to begin is by using free or low-cost tools. These provide market data, trends, and basic analytics, perfect for beginners. They help you understand Big Data concepts without significant costs.
Which Tools to Try?
- Yahoo Finance: A free platform offering stock prices, historical data, and basic charts. You can view company financials and market trends.
- Google Finance: Simple interface with real-time stock prices and news updates.
- TradingView: The free version includes powerful charting tools and basic predictive analytics.
- StockTwits: A social media platform where traders share opinions, useful for sentiment analysis.
How to Use Them?
- Pick a stock (like Reliance or Tesla) and check its historical data on Yahoo Finance.
- Create simple candlestick charts on TradingView and observe price trends.
- Check StockTwits to see what people are saying about the stock—positive or negative.
Real-Life Example: In 2021, during the Dogecoin craze, retail investors used StockTwits and Twitter for sentiment and Yahoo Finance for price trends. Beginners who used these tools profited from Dogecoin’s 50-100% surge.
Pro Tip: Focus on 2-3 stocks and spend 10-15 minutes daily exploring these tools to get comfortable with data.
Step 2: Learn Technical Analysis
To understand Big Data signals, you need basic knowledge of technical analysis, which involves reading market charts and indicators to decide when to buy or sell a stock.
Key Concepts to Learn:
- Candlestick Patterns: These visually show price movements. For example, a “Doji” pattern hints at a trend reversal.
- Indicators: Moving Averages (MA), Relative Strength Index (RSI), and MACD show trends and momentum.
- Support and Resistance: Price levels where a stock tends to move up or down.
How to Learn?
- Watch free YouTube tutorials, like “Technical Analysis for Beginners” by Zerodha Varsity.
- Open a stock chart on TradingView, add RSI or Moving Average, and practice.
- Read beginner-friendly books like the basic version of “Technical Analysis of the Financial Markets” by John Murphy.
Real-Life Example: In 2020, when Zoom’s stock was soaring, technical analysis combined with Big Data tools showed RSI overbought signals. Traders who understood this sold at the peak, locking in profits.
Pro Tip: Start with one indicator (like RSI) and master it before exploring others. Don’t overcomplicate!
Step 3: Monitor Social Media
A major part of Big Data is sentiment analysis, which gauges market mood from social media and news. Platforms like Twitter, Reddit, and StockTwits are where traders and investors share opinions that can impact stock prices. For beginners, these platforms are like a raw form of Big Data.
How to Use Them?
- Twitter: Follow hashtags like #Nifty50, #StockMarket, or specific stocks (like #Tesla). Track tweets from influential traders or analysts.
- Reddit: Join subreddits like r/WallStreetBets or r/IndianStreetBets and read discussions.
- StockTwits: Stock-specific platform for real-time sentiment.
Real-Life Example: In 2021, during the GameStop saga, Reddit’s WallStreetBets drove the stock from $20 to $483. Beginners who tracked sentiment on Reddit and Twitter profited from the rally.
Pro Tip: Beware of fake news or hype on social media. Focus on verified accounts or reputed sources.
Step 4: Practice Paper Trading
Before using Big Data signals with real money, try paper trading. This is a virtual trading platform where you can practice trades with real market data without risking money. It builds confidence in understanding and acting on Big Data signals.
Which Platforms to Use?
- TradingView: Offers a paper trading feature to create a virtual portfolio.
- Zerodha Streak: For Indian users, allows algo-based paper trading.
- Thinkorswim by TD Ameritrade: Free paper trading platform for international users.
How to Do It?
- Pick a stock and analyze its data on Yahoo Finance or TradingView.
- Form a hypothesis, like “If RSI goes above 70, sell the stock.”
- Test this strategy on a paper trading platform and track results.
Real-Life Example: Many beginners in 2020 tested strategies on Zoom and Tesla stocks via paper trading. Once confident, they made real trades, earning 50-100% returns.
Pro Tip: Practice paper trading for at least 1-2 months to understand Big Data signals and market flow.
Step 5: Stay Updated with News and Global Events
Big Data models are heavily influenced by news and global events (like interest rate changes, elections, or natural disasters). Without tracking these, you can’t fully leverage Big Data signals.
How to Stay Updated?
- News Apps: Use CNBC, Bloomberg, or Moneycontrol for daily updates.
- Economic Calendars: Check dates for economic events (like GDP reports, Fed meetings) on Investing.com or Forexfactory.
- Google Alerts: Set alerts for your favorite stocks or sectors.
Real-Life Example: In 2022, when the US Federal Reserve announced interest rate hikes, Big Data tools predicted a tech stock correction. Investors who followed news and economic calendars adjusted their portfolios, avoiding losses.
Pro Tip: Spend 10 minutes daily reading news to understand the context of Big Data signals.
Challenges You Might Face
Starting with Big Data can bring some hurdles:
- Data Overload: The volume of data can be confusing initially. Solution: Focus on one stock or sector.
- Technical Knowledge: Tools can seem complex. Solution: Learn from YouTube tutorials or online courses.
- Time Commitment: Data analysis and market tracking take time. Solution: Dedicate 30-60 minutes daily.
Steps to Start Using Big Data
If you want to use Big Data in the stock market, follow these steps:
- Start with Basic Tools: Use platforms like Yahoo Finance or Google Finance to understand data and trends.
- Learn Technical Analysis: Master candlestick patterns and indicators like RSI and MACD to interpret Big Data signals.
- Monitor Social Media: Stay active on Twitter and Reddit to gauge market sentiment.
- Practice Paper Trading: Test strategies on virtual platforms like TradingView before investing real money.
- Stay Updated: Follow market news and global events, as Big Data relies on these.
FAQs: Common Questions About Big Data and the Stock Market
- Is Big Data useful for retail investors?
Yes, absolutely! Tools like Yahoo Finance and StockTwits are accessible and provide valuable insights for retail investors. - Are expensive tools necessary for Big Data?
No, you can start with free tools. Paid tools like Bloomberg are more advanced, but free platforms are sufficient for beginners. - Is Big Data always accurate?
No, Big Data signals can sometimes be wrong. Combine them with your own research and analysis. - What is sentiment analysis, and how does it work?
Sentiment analysis scans social media and news to determine public opinion about a stock or company—positive or negative. - Is success in the stock market possible without Big Data?
Yes, it’s possible! Fundamental and technical analysis can lead to success, but Big Data makes your decisions sharper.
Conclusion: Become a Smart Investor with Big Data
In the stock market, information and timing are key to success. Big Data provides both—real-time insights and future predictions. It’s a tool that helps you extract meaningful signals from market noise. However, you must combine Big Data with knowledge and discipline. Start small, try free tools, and gradually build your skills. With Big Data, you can turn the stock market into your playground and make smarter investment decisions!
Note: If you want to dive deeper into any specific tool (like TradingView or Python libraries) or need help setting up a paper trading account, let me know, and I can guide you further! Additionally, if you’d like a chart to visualize how Big Data tools correlate with stock price movements (e.g., GameStop’s 2021 surge), I can create one—just confirm if you want it.