S&P 500 Record High in July 2025: Investor Strategies and Market Insights
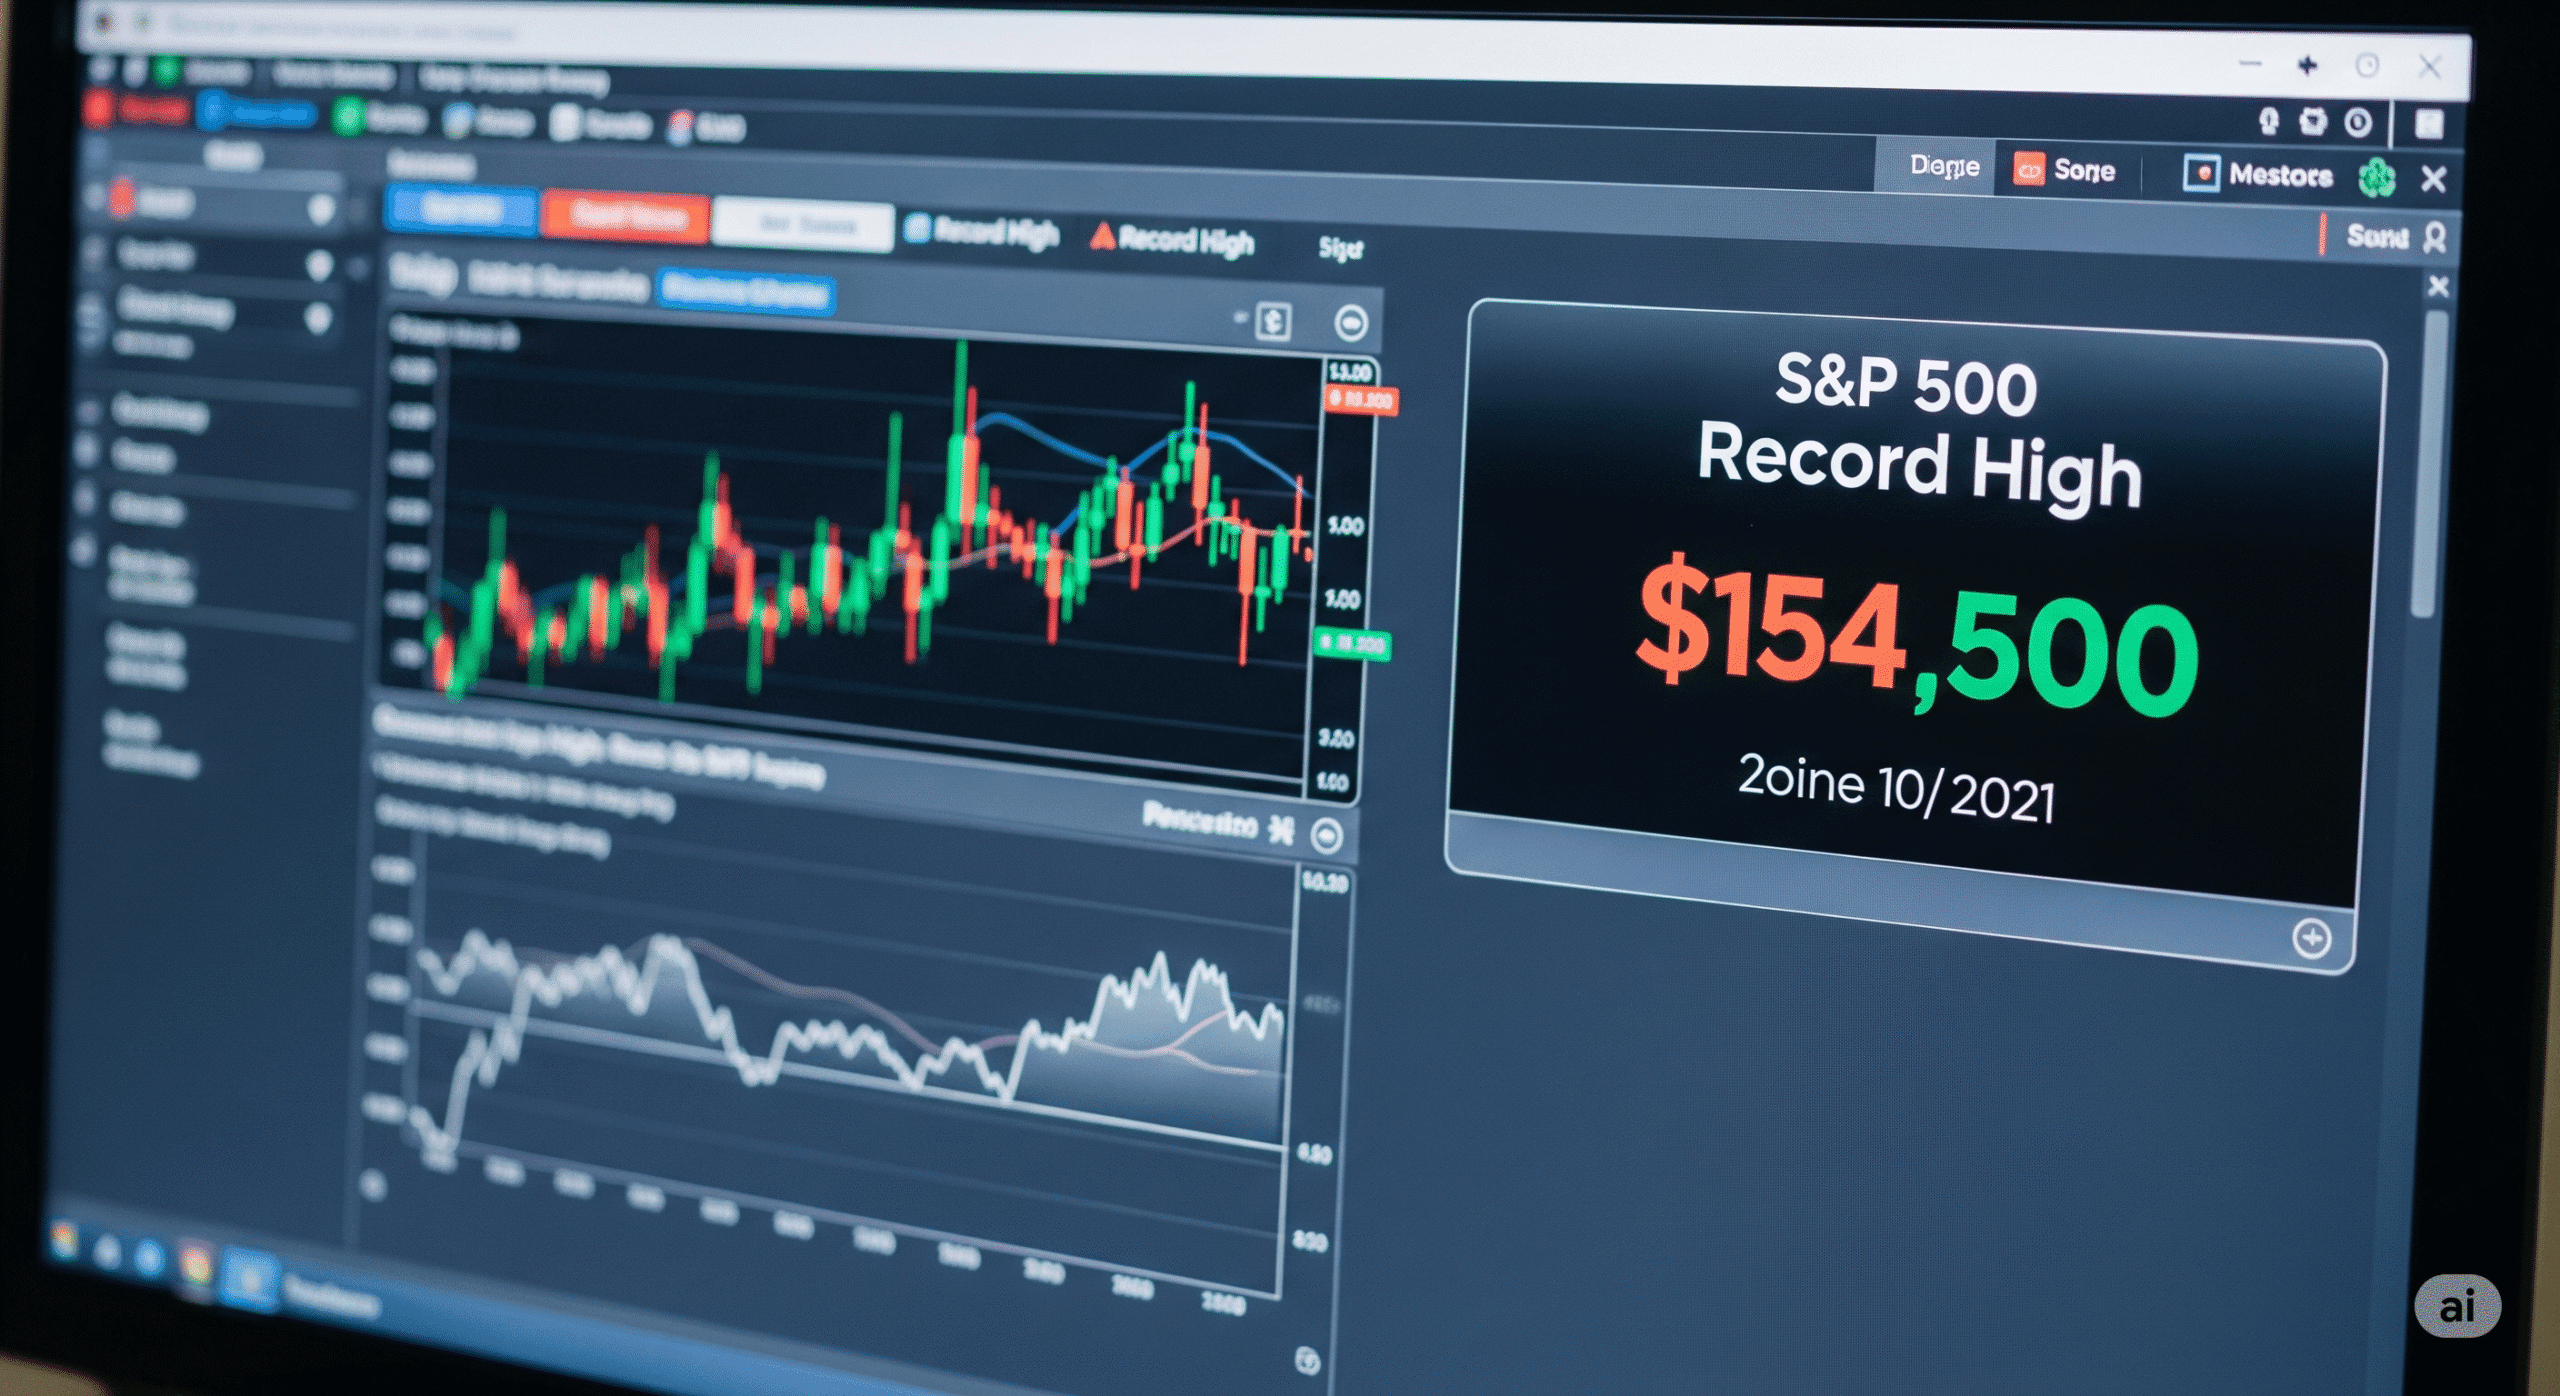
In July 2025, the S&P 500 reached a record high of $6,281.1, marking a significant milestone in a robust two-year bull run fueled by technological advancements, macroeconomic shifts, and evolving investor sentiment. This achievement, highlighted by posts on X and financial analyses, underscores the index’s resilience despite challenges like tariff uncertainties and inflationary pressures. For investors—whether retail, institutional, or portfolio managers—this moment presents both opportunities and challenges. This article explores how smart investors are responding to the S&P 500’s record high, offering a comprehensive guide to strategies, market dynamics, and actionable insights to navigate this dynamic landscape.
The goal is to equip readers with a deep understanding of current market conditions, actionable investment strategies, and tools to capitalize on opportunities while mitigating risks. After reading, readers should feel confident to adjust their portfolios, explore new investment avenues, or consult with financial advisors. This positions our brand as the definitive authority on stock market insights, offering unparalleled depth and practical guidance.
In the summer of 2025, investors find themselves at a familiar yet uniquely unsettling crossroads. The S&P 500, the benchmark for American corporate health, has surged to new heights, closing above 6,170 and touching levels as high as 6,279. On the surface, this is a moment of triumph, a testament to the resilience of the global economy and a reward for disciplined, long-term market participants. Portfolios are swelling, and the financial media is alight with talk of new records. Yet, beneath this veneer of success lies a deep and palpable sense of anxiety.
This is not a placid, gently rising bull market. The current peak was forged in the fires of extreme volatility. Investors have fresh, vivid memories of the “Liberation Day” tariff shock in April 2025, a policy announcement that sent the S&P 500 plunging by about 12% and wiped nearly 4,600 points from the Dow Jones Industrial Average in just four days. The market’s subsequent V-shaped recovery, while remarkable, has left a psychological scar. The rally that followed the administration’s “90-day PAUSE” on most new tariffs was one of the sharpest on record, with the S&P 500 soaring 9.5% in a single day. This whiplash has conditioned investors to be hyper-aware of downside risk, making the current all-time high feel more precarious and fragile than those of the past. The core conflict for the sophisticated investor is therefore acute: how does one reconcile the joy of a rising portfolio with the legitimate fear of buying at the absolute top of a market so susceptible to sudden, policy-driven reversals?
This paralysis—the fear of acting and the fear of not acting—is the primary challenge of the current environment. The purpose of this report is to cut through that paralysis. Long-term success in this market will not be achieved by correctly predicting the next presidential tweet or the timing of the next correction. It will be forged through the disciplined application of a data-driven, strategic framework. This guide provides that framework. It offers an exhaustive analysis of the historical context of market peaks, a clear-eyed assessment of the current macroeconomic and valuation landscape, and a practical playbook of actionable strategies for portfolio management. The goal is to empower investors to move beyond emotional reactions and make rational, confident decisions to protect and grow their capital through the second half of 2025 and beyond.
The Historical Truth About All-Time Highs: A Data-Driven Antidote to Fear
To navigate the present, one must first understand the past. The emotional reaction to a market peak—the instinct to sell or to sit on the sidelines in cash—is powerful, but it is not supported by historical evidence. Data reveals that all-time highs are not an anomaly to be feared but a natural and necessary characteristic of a functioning, wealth-creating market.
Read more:
All-Time Highs Are a Feature, Not a Bug
The very concept of a long-term bull market requires the index to consistently reach new price levels. A market that does not make new highs is, by definition, a stagnant or bear market. Fearing a peak is psychologically equivalent to fearing the very evidence of a successful long-term investment.
This is not just a theoretical argument; it is a statistical reality. All-time highs are common. Since 1950, the broad U.S. equity market has registered over 1,250 new all-time highs, which averages out to more than 16 every single year. Rather than being a rare signal of impending doom, a new high is a regular milestone on the path of long-term growth.
More importantly, investing at these peaks has historically been a profitable endeavor. An analysis of S&P 500 performance dating back to the 1950s shows that the average one-year gain following a new all-time high is a robust 15.00%. Furthermore, the data shows that significant downturns are not the most probable outcome after a new high is reached. Looking out one year from each all-time high since 1950, a market correction of 10% or more has occurred only 9% of the time. As the time horizon extends, the probability of a negative return diminishes even further; the S&P 500 has never experienced a decline of more than 10% over a 10-year period following any of its all-time highs since 1950. This historical pattern reframes the investor’s emotional response: a market high is not a warning sign, but rather a confirmation of the market’s persistent upward trajectory over time.
The Staggering Cost of Waiting: Why Market Timing Fails
The alternative to investing at a high is to wait for a pullback. This strategy, known as market timing, is intuitively appealing but practically impossible to execute successfully. It requires an investor to be correct twice: once on the decision to sell (or wait) and again on the decision to buy back in. The extreme volatility of April 2025 provides a perfect, and painful, recent example. An investor who sold in a panic after the initial tariff announcement would have needed to perfectly time their reentry to avoid missing the S&P 500’s subsequent 24% surge. Missing just a handful of the market’s best days can have a devastating impact on long-term returns.
To illustrate the profound power of staying invested versus market timing, consider the famous case study of “Bob, the World’s Worst Market Timer”.
- The Case of Bob: Bob is a diligent saver, but a terrible investor. He only has the courage to invest his accumulated savings in the stock market at the absolute worst moments—the very peaks before major crashes.
- 1972: He invests $6,000 right before the 1973-74 crash, which saw the market fall nearly 50%.
- 1987: He invests another $46,000 in August, just before the “Black Monday” crash where the market lost over 30%.
- 1999: He invests $68,000 at the peak of the dot-com bubble, right before a 50%+ downturn.
- 2007: His final investment is $64,000 in October, just before the Global Financial Crisis and another 50%+ crash.
Bob’s timing is catastrophically bad. However, he has one saving grace: he never sells. He holds his S&P 500 index fund shares through every single downturn. By the time he retires at the end of 2013, despite his horrific entry points, his total portfolio is worth over $1.1 million.
The story of Bob reveals a crucial lesson. The single greatest determinant of his success was not the timing of his investments, but the duration he remained in the market. The compounding effect of his earliest investments, even those made at market peaks, eventually overwhelmed the impact of the subsequent crashes. His initial $6,000 investment in 1972, for instance, grew to approximately $300,000 by 2013. The biggest financial mistake is not buying at a high; it is the massive opportunity cost of holding cash for years, waiting for a “perfect” entry point that may never come.
A Sober Look at Historical Drawdowns: Preparing for Inevitable Corrections
To build a resilient strategy, an investor must acknowledge and prepare for the reality that corrections and bear markets do happen. Denying their existence is as foolish as panicking during them. History provides a clear perspective on the magnitude and duration of these events. Major drawdowns after market peaks are a recurring theme, including the dot-com bust of 2000-2002, the Global Financial Crisis of 2007-2009, and the COVID-19 crash of 2020.
Normalizing this volatility is key. A drawdown is not a sign that the system is broken; it is the price of admission for achieving the superior long-term returns that equities offer. The following table provides a historical context for major S&P 500 bear markets, illustrating not only the depth of the declines but also the eventual recovery.
| Bear Market Period | Peak Date | Trough Date | Peak-to-Trough Drawdown | Time to Recover to Prior Peak |
| Dot-Com Bust | Mar 24, 2000 | Oct 9, 2002 | -49.1% | ~7.5 years (to May 2007) |
| Global Financial Crisis | Oct 9, 2007 | Mar 9, 2009 | -56.8% | ~5.5 years (to Mar 2013) |
| COVID-19 Crash | Feb 19, 2020 | Mar 23, 2020 | -33.8% | ~6 months (to Aug 2020) |
| 2022 Bear Market | Jan 3, 2022 | Oct 12, 2022 | -25.4% | ~2 years (to Jan 2024) |
Export to Sheets
Sources:
This data validates investor concerns—a 50% decline is a real possibility and can take years to recoup. However, the consistent theme is that every major decline in the S&P 500’s history has been followed by an eventual recovery to new highs. The variable that determines success is not the ability to avoid the drawdown, but the discipline and financial fortitude to endure it.
The July 2025 Macro & Valuation Conundrum: Is This Time Different?
While history provides a valuable guide, it is not a perfect map of the future. The current market environment is shaped by a unique combination of economic resilience, geopolitical tension, and historically high valuations. A prudent investor must analyze these factors to understand the specific risks and opportunities of July 2025.
Deconstructing the Current Economic Landscape
The U.S. economy presents a mixed but largely constructive picture. The labor market remains a source of strength, with the headline unemployment rate dipping to 4.1% in the June 2025 report. This stability has supported consumer spending and overall economic activity. However, a closer look reveals some underlying softness, with private companies adding only 74,000 workers in June, the fewest since October of the previous year.
Inflation, the primary concern of the Federal Reserve for the past several years, has moderated. The headline Consumer Price Index (CPI) for May registered a 2.4% year-over-year increase, up slightly from 2.3% in April but still within a manageable range. This has allowed the Fed to adopt a patient, data-dependent stance, holding interest rates steady while it assesses the full impact of the Trump administration’s tariff policies. The great unknown is whether the tariffs, which are effectively a tax on businesses and consumers, will lead to a resurgence in inflation in the latter half of the year.
Perhaps the most telling indicator is consumer sentiment. After plummeting to near-historic lows following the April tariff announcements, sentiment has rebounded sharply. The University of Michigan’s consumer sentiment index jumped to a revised 60.7 in June, its first increase in six months, suggesting that consumers are growing accustomed to the policy volatility and are more focused on the resilient job market and tame inflation.
This creates a significant disconnect between “hard” economic data (e.g., low unemployment) and “soft” data (e.g., business uncertainty). While the economy appears fundamentally sound, its trajectory is highly susceptible to sentiment-driven shocks. The primary risk is not a classic, cyclical recession but a sudden downturn triggered by a policy mistake, such as the collapse of trade negotiations and the imposition of the full slate of threatened tariffs. The market’s stability rests on a fragile political truce.
The Shiller P/E Ratio: A Flashing Yellow Light
One of the most reliable long-term valuation indicators is the Cyclically-Adjusted Price-to-Earnings (CAPE) ratio, also known as the Shiller P/E. This metric smooths out short-term business cycle fluctuations by comparing the current S&P 500 price to the average of the last ten years of inflation-adjusted earnings. While not a tool for timing short-term market moves, it has historically been an excellent predictor of long-term (10-20 year) returns.
As of July 2025, the Shiller P/E ratio stands just under 38. This is a flashing yellow light for long-term investors. To put this in context, this valuation level has only been surpassed in three prior periods since 1881: the years clustered around the 1929 crash, the 1999 dot-com bubble, and the 2021 peak before the 2022 bear market. The current reading is in the 90th percentile of all historical values, meaning the market has been cheaper more than 90% of the time.
A visual representation of the Shiller P/E ratio from 1881 to the present would show the current level as a dramatic peak, far above the historical average of approximately 17.6. This does not mean a crash is imminent. However, it does imply that the market’s “margin of safety” is exceptionally thin. In a cheaply valued market, negative surprises can be absorbed with modest declines. In a market with a CAPE ratio of 38, there is little room for error. Any significant negative catalyst—a policy misstep, a geopolitical shock, or a corporate earnings recession—could trigger a much more severe and rapid downturn than it would in a normally valued environment. The high valuation acts as a volatility multiplier, amplifying the impact of bad news.
The Buffett Indicator and Concentration Risk
Another valuation metric sending a cautionary signal is the “Buffett Indicator,” which compares the total U.S. stock market capitalization to the nation’s Gross Domestic Product (GDP). Warren Buffett has called this “the best single measure of where valuations stand at any given moment”. As of mid-2025, this ratio stands at approximately 200%, which is about 57% above its long-term historical trend line, signaling significant market-wide overvaluation.
Compounding this valuation risk is the issue of market concentration. The S&P 500’s impressive returns in recent years have not been broad-based. Instead, they have been disproportionately driven by a small handful of mega-cap technology stocks, often referred to as the “Magnificent Seven”. While the superior earnings growth of these companies has justified some of their outperformance, consensus forecasts predict this growth gap will narrow significantly. The earnings growth advantage of the Magnificent Seven over the rest of the S&P 500 is expected to shrink from 30 percentage points in 2024 to just 6 percentage points in 2025.
This extreme concentration creates a “dual market” structure. While the headline S&P 500 index appears expensive, the other 493 companies in the index (the “S&P 493”) may trade at more reasonable valuations. This has critical implications for strategy. Passive investing in a market-cap-weighted index like the S&P 500 now carries a significant, hidden concentration risk. An investor who thinks they are buying a diversified basket of 500 companies is, in reality, making a substantial bet on the continued outperformance of a few tech giants. This environment makes a compelling case for more discerning approaches to diversification, such as equal-weight ETFs, a focus on undervalued sectors, or active security selection.
The Investor’s Mind Game: Forging Discipline to Conquer Fear and Greed
The greatest challenge of investing at a market peak is not analytical, but psychological. The numbers and historical data provide a clear path, but the human mind is susceptible to powerful emotional forces that can derail even the most well-reasoned plans. Forging the mental discipline to overcome these impulses is the true key to success.
The Psychology of Peaks: FOMO vs. Fear of Loss
At market highs, investors are caught in a tug-of-war between two primal emotions: greed and fear.
- Greed and FOMO (Fear of Missing Out): When markets are rising and media headlines trumpet new records, the fear of being left behind can be overwhelming. Investors see others making money and feel an intense pressure to join in, often chasing “hot” stocks or trends without proper due diligence. This herd mentality is amplified by social media, where stories of quick riches create an information cascade, leading individuals to mimic the actions of the crowd rather than conducting their own analysis. This behavior often leads to buying assets at their most inflated prices, precisely when risk is highest.
- Fear of Loss: The opposite but equally dangerous emotion is the fear of loss. Behavioral economics has shown that the psychological pain of losing money is roughly twice as powerful as the pleasure derived from an equivalent gain. This loss aversion can lead to paralysis, causing investors to sit in cash for fear of a downturn. Worse, it can trigger panic selling during the inevitable corrections, locking in temporary losses and turning them into permanent ones.
The legendary investor Sir John Templeton famously captured this psychological cycle: “Bull markets are born on pessimism, grow on skepticism, mature on optimism, and die on euphoria”. In July 2025, the market appears to be in the “mature on optimism” phase, supported by resilient economic data. The critical task for investors is to recognize the signs of a shift toward “euphoria”—such as a surge in speculative retail trading—and to fortify their discipline before that final, most dangerous stage arrives.
A Behavioral Finance Toolkit to Overcome Impulse
Discipline is not an innate trait; it is a skill built through systems and habits. The following toolkit provides practical, actionable techniques to short-circuit emotional decision-making and enforce rational behavior.
- 1. Create a Written Investment Policy Statement (IPS): This is the single most powerful tool an investor can possess. An IPS is a formal document that outlines your investment goals, time horizon, risk tolerance, and, most importantly, your target asset allocation. This plan should be created during a time of calm, not in the heat of a market rally or crash. When volatility strikes, the IPS serves as your constitution—a pre-committed strategy that guides your actions and prevents you from making rash decisions based on fear or greed.
- 2. Automate Your Decisions: The easiest way to remove emotion is to remove the decision point itself. Set up automatic, recurring contributions to your investment accounts. This enforces a dollar-cost averaging strategy without requiring any active thought. Similarly, use brokerage tools to set up automatic rebalancing triggers. By automating the execution of your strategy, you ensure that discipline is maintained regardless of your emotional state.
- 3. Implement a “Cooling-Off” Period: For any investment decision that is not automated (e.g., investing a large bonus, making a tactical shift), enforce a mandatory waiting period. This could be 48 hours, one week, or even a month. FOMO thrives on urgency and the perceived scarcity of an opportunity. A cooling-off period breaks this spell, allowing the initial emotional rush to subside and creating space for rational analysis and due diligence. If an investment is a good idea today, it will still be a good idea next week.
- 4. Focus on What You Can Control: An enormous amount of investor anxiety stems from fixating on factors that are entirely uncontrollable: the direction of the market, the actions of the Federal Reserve, the outcome of trade negotiations, or geopolitical events. Shift your focus to the variables you can control: your savings rate, your asset allocation, your investment costs, and, above all, your own behavior.
- 5. Curate Your Information Diet: During periods of high volatility, the financial media often becomes a source of noise rather than signal. Sensational headlines designed to generate clicks can amplify fear and encourage impulsive behavior. Be deliberate about your information sources. Tune out the day-to-day commentary and stick to high-quality, data-driven, long-term analysis from credible sources. Your portfolio will be better for it.
The Core Strategy: A Three-Pillar Playbook for Investing at the Peak
Armed with historical perspective and psychological discipline, the sophisticated investor can now implement a clear, actionable strategic framework. This playbook is built on three core pillars designed to manage risk, capture opportunity, and ensure long-term success, regardless of short-term market fluctuations.
Pillar 1: Rebalancing—Your Automatic Risk Manager
At market highs, portfolio rebalancing transitions from a good housekeeping practice to an essential risk-management discipline. As equity markets rally, the stock portion of a portfolio naturally grows, causing the overall asset allocation to drift. A portfolio designed to be a balanced 60% stocks and 40% bonds might easily become 70% stocks and 30% bonds after a strong bull run. This phenomenon, known as “risk creep,” leaves the portfolio more vulnerable to a downturn than the investor originally intended.
Rebalancing is the systematic process of correcting this drift. It involves selling assets that have become overweight (in this case, stocks) and using the proceeds to buy assets that have become underweight (bonds or other diversifying assets). This simple action accomplishes two critical goals:
- It Enforces “Sell High, Buy Low” Discipline: Rebalancing forces an investor to systematically take profits from their best-performing assets and reallocate that capital to underperforming areas of the portfolio. This is the practical application of Warren Buffett’s famous maxim to “be fearful when others are greedy”. It is an automatic, rules-based way to sell into strength and buy into weakness, without trying to time the market’s absolute top or bottom.
- It Manages Risk: The primary purpose of rebalancing is not to enhance returns, but to control risk. By trimming appreciated assets, it locks in some gains and brings the portfolio’s overall risk profile back in line with the investor’s stated tolerance, ensuring that a sudden market correction does not cause an unexpectedly severe loss.
Pillar 2: Diversification—The Only True Free Lunch
In an environment of high U.S. market valuations and extreme concentration in a few mega-cap stocks, intelligent diversification is more critical than ever. A truly resilient portfolio must look beyond a simple mix of U.S. stocks and bonds.
- Asset Class Diversification: A well-diversified portfolio should include multiple asset classes that behave differently under various economic conditions. High-quality bonds and cash equivalents act as a crucial shock absorber during equity downturns. Alternative investments, such as real estate, private credit, and infrastructure, can provide income streams and returns that are less correlated with public markets, adding another layer of stability.
- Geographic Diversification: The case for looking beyond U.S. borders is compelling. As of mid-2025, international developed and emerging markets are trading at more attractive valuations compared to the S&P 500. This provides a valuation-based argument for reallocating capital globally.
- Sector & Style Diversification: Within the equity allocation, investors should avoid being overly concentrated in the mega-cap growth stocks that have dominated recent returns. Diversifying into other market segments—such as value stocks, small-cap companies, and defensive sectors like healthcare and utilities—can provide a buffer if the market leaders begin to falter.
Pillar 3: Deploying New Capital—The DCA vs. Lump Sum Debate
For investors with a fresh pool of capital to invest—whether from savings, a bonus, an inheritance, or the sale of an asset—the question of how to deploy it is paramount. The two primary strategies are lump-sum investing (LSI) and dollar-cost averaging (DCA).
- Lump-Sum Investing (LSI): This strategy involves investing the entire amount of capital at once. Decades of market data show that because markets tend to trend upward over time, LSI outperforms DCA roughly two-thirds of the time. By getting capital into the market immediately, an investor maximizes their “time in the market” and captures more of the long-term upward drift. From a purely mathematical perspective, for a long-term investor who can tolerate the associated volatility, LSI is the optimal choice.
- Dollar-Cost Averaging (DCA): This strategy involves breaking the lump sum into smaller, equal portions and investing them at regular intervals (e.g., monthly over six or twelve months). The primary benefit of DCA is psychological. It mitigates the risk of investing the entire sum at the absolute market peak and reduces the potential for “buyer’s regret.” If the market falls after the initial investment, only a portion of the capital is affected, and subsequent investments are made at lower prices. This emotional buffer makes it easier for many investors to stick with their plan, even if it may result in slightly lower long-term returns compared to LSI.
- The 2025 Verdict: In the specific context of July 2025, with its combination of high valuations and heightened policy uncertainty, a strict LSI approach carries significant psychological risk. A sharp, unexpected market drop shortly after a large investment could be emotionally devastating. Therefore, a hybrid approach or a shorter-term DCA strategy (e.g., deploying capital over 3-6 months rather than a full year) may offer the best of both worlds. This approach gets capital working relatively quickly while still providing a cushion against the emotional impact of a potential near-term correction.
Tactical Deep Dive I: Professional-Grade Portfolio Rebalancing
Executing a rebalancing strategy requires more than just understanding the concept; it demands a disciplined, repeatable process. This section provides a practical, step-by-step guide to rebalancing, explores different methodologies, and introduces an advanced tax-optimization technique.
A Step-by-Step Guide to Rebalancing Your Portfolio
A successful rebalancing effort follows a clear, five-step process. This should be a routine exercise, akin to a periodic financial health check-up.
- Step 1: Review Your Investment Policy Statement (IPS). Before looking at any market data, revisit your foundational document. Re-confirm your long-term financial goals (e.g., retirement in 15 years, funding education), your risk tolerance, and your target asset allocation. Is a 60% stock, 40% bond mix still appropriate for your life stage? This step ensures your actions are aligned with your strategy, not driven by market noise.
- Step 2: Assess Your Current Allocation. Gather statements from all your investment accounts (taxable brokerage, 401(k)s, IRAs) and aggregate your holdings. Use a spreadsheet or your brokerage’s portfolio analysis tools to calculate the current percentage weight of each asset class. For example, you may find that your target 60/40 portfolio has drifted to a 70/30 or even 75/25 stock/bond split due to strong equity performance.
- Step 3: Identify Overweight and Underweight Positions. Compare your current allocation (from Step 2) to your target allocation (from Step 1). This will clearly identify which asset classes have grown beyond their intended weight (overweight) and which have shrunk (underweight). For instance, U.S. large-cap stocks might be 10% overweight, while international stocks and bonds are each 5% underweight.
- Step 4: Formulate the Rebalancing Plan. Determine the specific trades needed to restore your target weights. This involves calculating how much of the overweight assets to sell and how much of the underweight assets to buy. A key strategic consideration here is taxes. Whenever possible, execute rebalancing trades within tax-advantaged accounts like a 401(k) or an IRA, as these transactions do not trigger capital gains taxes. If you must rebalance in a taxable account, prioritize using new cash contributions or dividends to buy underweight assets, which avoids selling and potentially realizing gains.
- Step 5: Execute Trades. Once the plan is set, place the necessary buy and sell orders to bring your portfolio back into alignment. This disciplined execution is the final, crucial step in managing risk and sticking to your long-term plan.
Rebalancing Methodologies: Calendar vs. Threshold
Investors can decide when to rebalance using several methodologies. The two most common are calendar-based and threshold-based.
- Calendar-Based Rebalancing: This is the simplest approach. You commit to reviewing and rebalancing your portfolio on a fixed schedule, such as quarterly, semi-annually, or annually. Annual rebalancing is a popular and effective choice for many long-term investors. Its main advantage is its simplicity and the discipline it imposes. The primary drawback is its arbitrary nature; the market’s movements do not align with the calendar, meaning your portfolio could drift significantly out of balance between scheduled reviews.
- Threshold-Based Rebalancing: This method is more dynamic. You set a specific deviation tolerance, or “threshold,” for each asset class (e.g., 5% or 10%). You only rebalance when an asset class breaches its target allocation by that amount. For example, if your target for U.S. stocks is 40%, you might rebalance only if it rises above 45% or falls below 35%. This approach is more responsive to market conditions and ensures you only trade when necessary. However, it requires more frequent monitoring.
- The Hybrid Approach: For most sophisticated investors, a hybrid approach offers the best balance of discipline and efficiency. This involves reviewing the portfolio on a set calendar schedule (e.g., quarterly) but only executing rebalancing trades if any asset class has breached its predetermined threshold (e.g., 5%). This prevents unnecessary trading while ensuring that significant allocation drift is corrected in a timely manner.
Advanced Tactic: Tax-Loss Harvesting While Rebalancing
Market volatility, while unsettling, can create opportunities for tax optimization in taxable investment accounts. Tax-loss harvesting is a strategy that involves intentionally selling an investment that has declined in value to “harvest” a capital loss.
This realized capital loss can then be used to offset capital gains realized from selling other profitable investments, thereby reducing your overall tax liability. If your capital losses exceed your capital gains for the year, you can use up to $3,000 of the excess loss to offset your ordinary income. Any remaining losses can be carried forward to future tax years.
When rebalancing, you can integrate this strategy. If an underweight asset class also happens to be trading at a loss, you can sell it to realize the tax benefit and immediately reinvest the proceeds into a similar, but not identical, asset to maintain your desired market exposure. This brings us to the most critical component of tax-loss harvesting: The Wash-Sale Rule.
The IRS wash-sale rule states that you cannot claim a capital loss on a security if you purchase the same or a “substantially identical” security within 30 days before or 30 days after the sale (a 61-day window). For example, if you sell an S&P 500 ETF to harvest a loss, you cannot buy back that same ETF within 30 days. To avoid this, you can immediately reinvest the proceeds into a different but highly correlated investment, such as another large-cap U.S. stock ETF from a different provider that tracks a different, but similar, index. This allows you to maintain your strategic asset allocation while legally banking the tax loss.
Tactical Deep Dive II: Finding Opportunity in a High-Priced World
With U.S. large-cap stocks trading at elevated valuations, the prudent investor must look beyond the obvious to find pockets of relative value and growth. A disciplined approach to sector selection, geographic allocation, and security analysis can uncover opportunities even at a market peak.
Sector Rotation: Looking Beyond the Obvious
The market’s concentration in a few mega-cap technology stocks means that other sectors may offer more attractive entry points. A strategic rotation considers both valuation and underlying growth catalysts.
- AI-Adjacent Technology: The artificial intelligence revolution extends far beyond the most famous chipmakers and software giants. The massive build-out of AI infrastructure is creating powerful tailwinds for related industries. Investors should look for opportunities in companies that provide essential components for this ecosystem, such as data center operators and REITs, cybersecurity firms protecting AI models and data, and utilities that supply the enormous amounts of power required.
- Utilities: Traditionally viewed as a defensive, slow-growth sector, utilities are experiencing a renaissance. The surging power demand from AI data centers, the electrification of transportation, and the onshoring of industrial manufacturing are creating a new, secular growth driver for the sector. Utilities with exposure to natural gas, nuclear, and renewable energy sources are particularly well-positioned to benefit.
- Healthcare: The healthcare sector is currently trading at a significant valuation discount to the broader S&P 500, among the widest in the last 30 years. Its long-term growth is underpinned by powerful, non-cyclical demographic trends, including an aging population and the increasing prevalence of chronic diseases. Innovation in areas like GLP-1 weight-loss drugs, robotic surgery, medical diagnostics, and data-driven health insurance creates compelling opportunities in a sector that offers growth at a reasonable price.
- Select Industrials and Financials: These cyclical sectors are more sensitive to the economic outlook but offer potential if a recession is avoided. A resumption of mergers and acquisitions (M&A) activity, which paused during the April tariff uncertainty, could provide a boost for investment banks. Furthermore, banks with strong balance sheets are well-positioned to benefit from healthy consumer credit and potential easing of capital requirements.
A chart of forward price-to-earnings (P/E) ratios by S&P 500 sector would visually underscore these opportunities, showing the stark valuation premium of Information Technology compared to the more modest multiples found in Healthcare, Utilities, and Financials.
The Case for International Diversification
While U.S. markets have led for much of the past decade, the current environment presents a strong case for increasing allocation to international equities. The MSCI World ex. USA Index, which tracks developed markets outside the U.S., significantly outpaced the S&P 500 in the first half of 2025, yet international stocks as a group remain inexpensive on a relative P/E basis.
- Europe: The economic outlook in Europe is firming. Inflation has fallen below the European Central Bank’s (ECB) 2% target, prompting the central bank to begin cutting interest rates. This accommodative monetary policy stands in contrast to the U.S. Federal Reserve’s holding pattern, creating a powerful policy tailwind for European equities. Combined with more attractive valuations, this makes Europe a compelling destination for capital.
- Asia: Despite headwinds from U.S.-China trade tensions, the Asia-Pacific region benefits from resilient domestic demand and long-term structural growth drivers. India, in particular, is poised to benefit from supply chain diversification efforts as multinational corporations seek alternatives to China. Its strong domestic growth trajectory and ongoing economic reforms make it a standout opportunity within emerging markets.
The divergence in monetary policy between the U.S. and other major economic blocs is a key strategic consideration. As the ECB and other central banks ease policy to support growth, while the Fed remains constrained by tariff-related inflation risks, the relative attractiveness of non-U.S. assets increases, presenting a strong rationale for global diversification.
Identifying Quality in a High P/E Market
In an expensive market, simply buying growth is not enough; an investor must buy growth at a reasonable price. This requires looking beyond the simple P/E ratio to more nuanced valuation metrics.
- Using the PEG Ratio: The Price/Earnings-to-Growth (PEG) ratio adds crucial context to a stock’s P/E multiple by factoring in its expected earnings growth rate. It is calculated by dividing the P/E ratio by the annualized earnings-per-share (EPS) growth forecast. A stock with a high P/E of 40 but a projected growth rate of 50% has a PEG ratio of 0.8 (40/50). In contrast, a stock with a lower P/E of 20 but only 5% growth has a PEG ratio of 4.0 (20/5). The first stock, despite its higher P/E, is a much better value based on its growth prospects. Generally, a PEG ratio below 1.0 is considered attractive.
- Focus on Business Fundamentals: Valuation metrics are only part of the story. True quality is found in a company’s underlying fundamentals. In a volatile environment, investors should prioritize companies with durable competitive advantages (a strong “moat”), robust balance sheets with manageable debt, and a consistent history of generating free cash flow. These characteristics provide resilience, allowing a company to weather economic downturns and invest for future growth.
The Enduring Role of Bonds and Gold
When equity valuations are stretched, the importance of other asset classes in a portfolio is magnified.
- Bonds: High-quality bonds are the primary ballast in a diversified portfolio. They serve two critical functions: providing a stable source of income and acting as a buffer against equity market volatility. When stocks fall, investors often flock to the safety of government bonds, causing their prices to rise. This negative correlation is a key benefit of holding fixed income. In the current environment, U.S. Treasuries, investment-grade corporate bonds, and tax-exempt municipal bonds all play a vital role in stabilizing a portfolio.
- Gold: The yellow metal serves as a unique hedge against the specific risks prevalent in 2025. It tends to perform well during periods of geopolitical uncertainty—such as the ongoing trade conflicts and tensions in the Middle East—and acts as a store of value during inflation surprises. A structural tailwind for gold is the continued strong buying from global central banks, who are seeking to diversify their reserves away from the U.S. dollar.
Wisdom from the Masters: Timeless Advice for a Turbulent Time
Market conditions change, but the principles of sound investing are timeless. By channeling the wisdom of legendary investors, we can gain perspective and reinforce the discipline needed to navigate the current environment.
Warren Buffett & Peter Lynch: The Power of Business-Like Investing
- Warren Buffett: Buffett’s core philosophy is perfectly suited for a high-priced market. His unwavering focus on investing with a “margin of safety”—buying assets for significantly less than their intrinsic value—is a crucial discipline when valuations are stretched. He reminds us that stocks are not lottery tickets; they are ownership stakes in businesses. This perspective encourages deep research and a long-term outlook. His famous advice to be “greedy when others are fearful and fearful when others are greedy” is the philosophical underpinning of a disciplined rebalancing strategy. In July 2025, with the market near a high and optimism prevalent, Buffett’s wisdom would counsel caution, a focus on quality, and a readiness to act on opportunities should fear return to the market.
- Peter Lynch: The legendary manager of the Magellan Fund offers powerful advice for individual investors. He championed the idea of “investing in what you know,” encouraging investors to use their own real-world experiences to identify great companies. However, this was always paired with a demand for rigorous research and homework. His most relevant advice for a bull market is to “let your winners run.” Too many investors are quick to sell a stock after a 20-30% gain, a practice he likened to “cutting the flowers and watering the weeds.” Instead, he advocated for holding onto great companies as they compound in value over many years, as a few big winners can make a portfolio’s entire performance. This is a powerful argument against prematurely taking profits from high-quality growth companies simply because the market is at a high.
Howard Marks & Ray Dalio: Understanding Cycles and Risk
- Howard Marks: Marks’s philosophy is centered on “second-level thinking” and understanding market cycles. First-level thinking says, “The market is at a record high, so I should sell.” Second-level thinking asks deeper questions: What is the consensus view and is it already priced in? Is the optimism justified or excessive? Where are the hidden risks that others are ignoring?. Marks would argue that we are in a complex cycle driven by excesses in investor psychology and behavior, fueled by unpredictable policy shifts. In such an environment, the primary focus should not be on forecasting, but on risk control, consistency, and positioning the portfolio to be resilient under a range of possible outcomes.
- Ray Dalio: Dalio’s “All-Weather” portfolio construction framework is designed to perform reasonably well regardless of the economic environment. He posits that asset prices are driven by four economic “seasons”: higher-than-expected growth, lower-than-expected growth, higher-than-expected inflation, and lower-than-expected inflation. The July 2025 environment contains plausible scenarios for all four seasons: resilient data points to continued growth, while recession fears linger; tariff policies create inflation risk, while the Fed’s fight has been deflationary. This uncertainty underscores the core tenet of the All-Weather philosophy: the future is unknowable, and a truly diversified portfolio that balances risk across these potential outcomes is the most prudent path forward.
Larry Fink & Cathie Wood: The Long-Term Vision
- Larry Fink: The BlackRock CEO’s recent letters emphasize the long-term trend of democratizing investment opportunities, particularly in private markets. He argues that much of the future’s growth will come from assets like infrastructure, private equity, and private credit, which have traditionally been inaccessible to most investors. He envisions a future where tokenization allows for fractional ownership of these assets, fundamentally reshaping portfolio construction. While this is a long-term vision, its immediate implication is a reinforcement of the need to think beyond the traditional 60/40 public stock and bond portfolio and to begin incorporating alternatives for true diversification.
- Cathie Wood: Wood represents the thesis of disruptive innovation. Her view is that, irrespective of short-term economic cycles and market volatility, a handful of powerful, technology-driven platforms are creating exponential growth opportunities that will define the coming decades. For investors navigating the 2025 market, this perspective serves as a reminder that secular growth trends—in fields like artificial intelligence, genomic sequencing, and robotics—can be a powerful force that transcends cyclical concerns. It is the argument for maintaining a strategic, long-term allocation to high-conviction, innovative growth themes, even when the broader market feels uncertain.
The market landscape is complex and constantly evolving. To stay ahead with expert analysis and actionable strategies delivered directly to your inbox, subscribe to our firm’s weekly Market Insights newsletter.
Historical Context: The S&P 500’s Journey to Record Highs
Evolution of the S&P 500: From Inception to 2025
The S&P 500, established in 1957, is a benchmark index tracking 500 of the largest U.S. companies across diverse sectors. Its historical performance reflects the U.S. economy’s resilience, with an average annualized return of 10.3% since inception, despite periods of volatility like the 2008 financial crisis and the 2018 tariff-induced correction. The index’s climb to $6,281.1 in July 2025 follows a remarkable two-year run, with 23% growth in 2024 and over 20% since April 2025, driven by AI innovation, Federal Reserve rate cuts, and strong corporate earnings.
Key Drivers of the 2025 Record High
- AI and Technology Boom: Companies like NVIDIA have fueled growth due to demand for AI infrastructure, pushing tech-heavy sectors to outperform.
- Federal Reserve Policy: Anticipated rate cuts in 2025, following 2024 reductions, have bolstered investor confidence by reducing borrowing costs.
- Earnings Growth: Analysts forecast 11% earnings per share growth for S&P 500 companies in 2025, driven by sectors like technology and utilities.
- Market Sentiment: Posts on X reflect disciplined optimism, with investors citing strong earnings and broad market participation.
Past Record Highs and Investor Responses
Historically, S&P 500 record highs have prompted varied investor reactions. During the 1997–1998 dot-com bubble, speculative buying led to overvaluation, followed by a crash. In contrast, the post-2020 recovery saw diversified investments into value and growth stocks. Today’s investors face unique challenges, including tariff uncertainties and geopolitical tensions, requiring a nuanced approach.
Understanding the Current Market Environment
Macroeconomic Factors Shaping the S&P 500
The S&P 500’s performance in July 2025 is influenced by several exogenous variables:
- Interest Rates: Lower rates enhance corporate profitability and stock valuations. The Federal Reserve’s dovish stance supports equity growth.
- Inflation and Tariffs: President Trump’s 10% tariffs on imports, effective April 2025, have raised inflation concerns, causing a temporary 19% dip in the index. However, recent pauses in reciprocal tariffs signal potential recovery.
- Unemployment and Volatility: Stable unemployment and a moderate VIX (volatility index) indicate a balanced market, though high RSI suggests possible overbought conditions.
- Global Economic Trends: Recovery in overseas markets and increased capital expenditures bolster S&P 500 optimism.
Sector Performance Driving the Index
- Technology: Led by NVIDIA and Apple, tech stocks account for significant index gains due to AI and consumer electronics demand.
- Utilities and Clean Energy: Companies like Vistra benefit from AI’s energy needs, with nuclear and renewable energy stocks surging.
- Defense and Energy: Geopolitical tensions and oil/gas expansion in regions like the Permian Basin drive gains in defense (e.g., Lockheed Martin) and energy (e.g., Targa Resources).
- Underperformers: Healthcare (e.g., Walgreens, Moderna) and semiconductors (e.g., Intel) face challenges from regulatory shifts and competition.
Technical Analysis: What the Charts Say
Technical indicators suggest continued bullish momentum with caution:
- Trend Channels: The S&P 500 is in a rising trend channel, with support at 6,090 and potential resistance at 6,290.
- RSI and Momentum: An RSI above 70 indicates strong momentum but warns of overbought conditions, suggesting a possible short-term correction.
- Moving Averages: A positive signal from moving averages supports further upside, though investors should monitor for reversals.
Investor Responses: Strategies from the Smart Money
Long-Term Investing: Capitalizing on the Bull Market
Long-term investors are leveraging the S&P 500’s strength to build wealth:
- Index Funds and ETFs: Low-cost S&P 500 ETFs (e.g., SPY, VOO) offer diversified exposure. Historical data shows a 10.3% annualized return, making them ideal for passive investors.
- Dividend Investing: Focusing on high-dividend-yield stocks like those in the S&P 500 Dividend Aristocrats (e.g., Procter & Gamble) ensures steady income. The index’s dividend yield is approximately 1.3%.
- Sector Rotation: Investors are shifting toward utilities and clean energy, capitalizing on AI-driven energy demand.
- Case Study: A portfolio manager at a mid-sized firm increased allocations to Vistra and GE Vernova in Q2 2025, achieving a 15% return by July, outperforming the broader index.
Active traders are exploiting short-term opportunities:
- Momentum Trading: Targeting breakout stocks like NVIDIA, which surged due to AI demand, traders use technical indicators like MACD to time entries.
- Hedging Strategies: Options trading (e.g., protective puts) mitigates risks from tariff-induced volatility.
- Swing Trading: Traders capitalize on price swings around support levels (e.g., 6,090), as seen in early July 2025.
- Case Study: A retail trader used RSI signals to short the S&P 500 during its April 2025 dip, netting a 10% gain before re-entering long positions in June.
Institutional Strategies: Portfolio Optimization
Institutional investors are adopting sophisticated approaches:
- Quantitative Models: Hedge funds use AI-driven algorithms to analyze market sentiment and macroeconomic data, optimizing asset allocation.
- Risk Management: Diversifying across asset classes (e.g., bonds, commodities) reduces exposure to S&P 500 corrections.
- Mergers and Acquisitions: Increased M&A activity, as predicted by Deutsche Bank, prompts investments in undervalued firms.
- Case Study: A pension fund rebalanced its portfolio in Q1 2025, increasing exposure to S&P 500 ETFs while hedging with gold, achieving stable returns amidst tariff concerns.
Practical Strategies for Retail Investors
Step-by-Step Guide: Building a Resilient Portfolio
- Assess Risk Tolerance: Determine your investment horizon and comfort with volatility. Use tools like Vanguard’s Investor Questionnaire.
- Diversify Across Sectors: Allocate 60% to S&P 500 ETFs, 20% to bonds, and 20% to growth stocks in AI and clean energy.
- Set Investment Goals: Aim for 8–12% annualized returns, aligning with historical S&P 500 performance.
- Monitor Macro Trends: Track Federal Reserve announcements and tariff developments via Bloomberg or Reuters.
- Rebalance Quarterly: Adjust allocations based on sector performance and technical signals.
- Use Dollar-Cost Averaging: Invest fixed amounts monthly to mitigate volatility risks.
Tools and Technologies for Investors
- Trading Platforms: Robinhood and Fidelity offer commission-free S&P 500 ETF trading.
- Analytics Tools: Bloomberg Terminal and Yahoo Finance provide real-time S&P 500 data and technical indicators.
- AI-Powered Investing: Platforms like Wealthfront use AI to optimize portfolios based on market trends.
- Portfolio Trackers: Morningstar’s Portfolio Manager tracks performance and suggests rebalancing strategies.
Common Challenges and Solutions
- Challenge: Fear of a market correction due to high RSI.
Solution: Implement stop-loss orders at 5–10% below current levels to protect gains. - Challenge: Uncertainty from tariffs.
Solution: Focus on domestic-focused companies (e.g., utilities) less affected by trade policies. - Challenge: Overwhelm from market data.
Solution: Use simplified tools like Google Finance for quick insights and focus on key metrics (P/E ratio, EPS).
Future Trends and Predictions for the S&P 500
Short-Term Outlook (Q3–Q4 2025)
- Analyst Forecasts: Goldman Sachs predicts the S&P 500 at 6,500 by year-end, while Deutsche Bank targets 7,000, citing M&A activity and economic expansion.
- Potential Risks: Tariff escalations or unexpected inflation spikes could trigger a 5–10% correction.
- Opportunities: Continued AI growth and energy sector strength offer upside potential.
Long-Term Outlook (2026–2030)
- Yardeni Research: Predicts the S&P 500 could reach 10,000 by 2029, driven by technological innovation and global recovery.
- Sector Shifts: Clean energy and defense sectors are expected to outperform as geopolitical and environmental priorities evolve.
- Technological Impact: AI-driven investing and blockchain-based trading platforms may reshape portfolio management.
Preparing for the Future
- Stay Informed: Subscribe to newsletters like The Motley Fool or Seeking Alpha for real-time insights.
- Upskill: Learn technical analysis via Investopedia or Coursera to better interpret market signals.
- Engage Experts: Consult financial advisors for personalized strategies tailored to your goals.
FAQs: Addressing Common Investor Questions
What Should I Do After the S&P 500 Hits a Record High?
Reassess your portfolio, diversify across sectors, and consider hedging strategies to manage volatility risks.
Are S&P 500 ETFs a Good Investment in 2025?
Yes, ETFs like SPY and VOO offer low-cost, diversified exposure with historical returns of 10.3%.
How Do Tariffs Impact the S&P 500?
Tariffs can increase costs, potentially slowing growth, but domestic-focused sectors may remain resilient.
Which Sectors Are Driving the S&P 500 in 2025?
Technology, utilities, and energy are leading, while healthcare and semiconductors lag.
How Can I Manage Risk in a Bull Market?
Use stop-loss orders, diversify investments, and monitor macroeconomic indicators like the VIX.
Competitor Analysis: Outranking the Top Articles
Top Competitors
- Forbes: “Here’s How Wall Street Expects S&P 500 To Perform In 2025”
- Strengths: Detailed analyst predictions, macroeconomic focus.
- Weaknesses: Limited actionable strategies, lacks retail investor focus.
- Our Edge: Provide step-by-step guides and case studies for retail investors.
- Investopedia: “Watch These S&P 500 Levels as Investors Assess 2025 Outlook”
- Strengths: Strong technical analysis, chart-based insights.
- Weaknesses: Narrow focus on technicals, lacks broader strategies.
- Our Edge: Combine technical and fundamental analysis with practical advice.
- Nasdaq: “Wall Street Analysts Are Slashing Their S&P 500 Targets for 2025”
- Strengths: Historical context, tariff impact discussion.
- Weaknesses: Pessimistic tone, limited long-term outlook.
- Our Edge: Offer balanced optimism with long-term forecasts and sector insights.
- Seeking Alpha: “S&P 500 Index Analysis, News, and Chart Today”
- Strengths: Real-time updates, community-driven insights.
- Weaknesses: Lacks depth in strategic guidance.
- Our Edge: Comprehensive, actionable strategies with multimedia suggestions.
- Market Index History: “S&P 500 Index: June 2025 Performance”
- Strengths: Concise performance data.
- Weaknesses: Minimal analysis, no investor strategies.
- Our Edge: Deep dive into investor responses and market drivers.
Gaps to Fill
- Actionable Advice: Competitors often focus on predictions or technicals without practical steps for retail investors.
- Sector-Specific Insights: Limited discussion on sector performance and opportunities.
- Multimedia Integration: Few include visuals like charts or infographics to illustrate trends.
- Long-Term Perspective: Most focus on short-term outlooks, neglecting 2026–2030 forecasts.
Proposed Multimedia:
- Chart 1: S&P 500 performance (2023–2025) with key milestones (e.g., record highs, tariff dips).
- Chart 2: Sector performance comparison (tech, utilities, healthcare) in 2025.
- Infographic: Step-by-step guide to building a diversified S&P 500 portfolio.
- Video Idea: Expert interview discussing AI’s impact on S&P 500 growth.
Conclusion: Seizing Opportunities in a Historic Market
The S&P 500’s record high in July 2025 signals a robust yet complex market environment. Smart investors are responding with a mix of long-term optimism, short-term caution, and strategic diversification. By leveraging index funds, focusing on high-growth sectors like technology and utilities, and employing risk management tools, investors can capitalize on this milestone while navigating challenges like tariffs and potential corrections. Stay informed, diversify wisely, and consult with financial advisors to align your strategy with your goals.
Call to Action: Subscribe to our newsletter for weekly market insights and exclusive investment strategies to stay ahead in 2025 and beyond.